1. Tabulation : The arrangement of the raw data under various heads in the form of a table is called tabulation.
2. Tange of a Data : The difference between the largest and the smallest observations is called the range.
3. Frequency : The number of observation in a particular class is called its frequency.
4. Cumulative Frequency : The cumulative frequency of a particular class is the sum of all frequencies up to this class.
5. Frequency Distribution : The distribution of frequency in various classes is known as frequency distribution.
6. Types of Frequency Distribution :
(i). Exclusive or Continuous Form : Here, the classes are of the form 0 – 10 , 10 – 20 , 20 – 30 ……………..etc.
Here , 10 – 20 means 10 and more but less than 20
Thus , in 10 – 20 we include 10 and exclude 20.
Here in 10 – 20 , we have
lower limit = 10 Upper limit = 20
True lower limit = 10 True upper limit = 20
Class Size = (20 – 10 ) = 10
(ii). Inclusive or Discontinuous form : Here, the classes are of the form 0 -10, 11- 20, 21 – 30 ……………etc.
Here , 11 – 20 means 11 and more but less than 20 and 20
Thus, in 11 – 20 both 11 and 20 are included.
in 11 – 20 , we have
lower limit = 11 Upper limit = 20
True lower limit = 10.5 True upper limit = 20.5
Class size = (20.5 – 10.5) = 10
(iii). Class mark of a Class :

(iv). Range = (maximum value ) – ( minimum value )
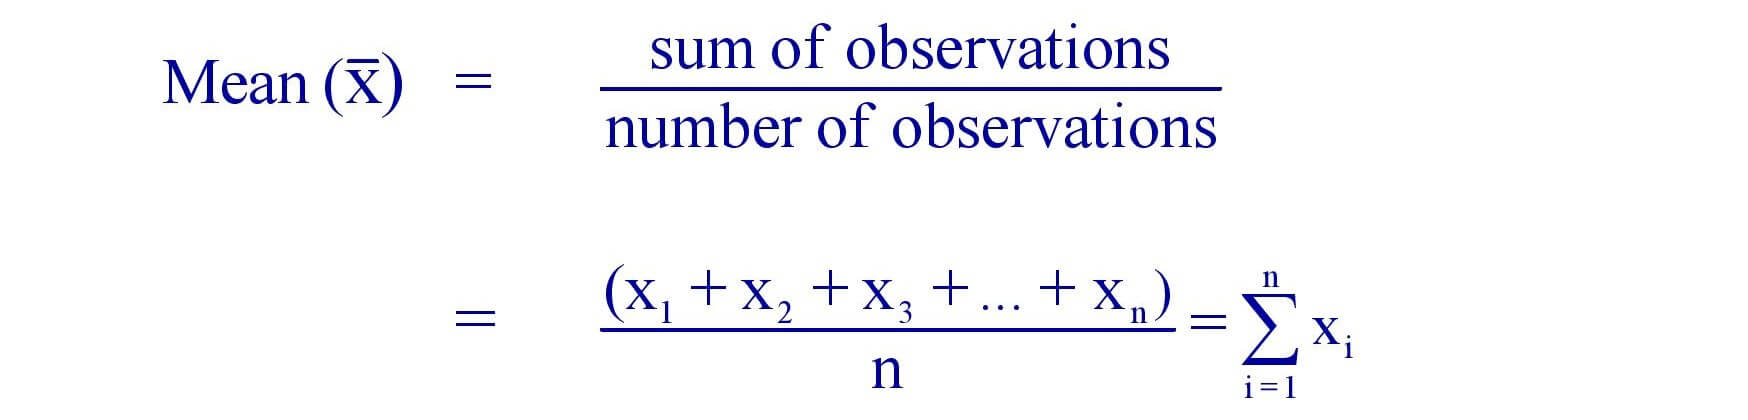
7. Arithmetic Mean : The average of a given set of numbers is called the arithmetic mean.
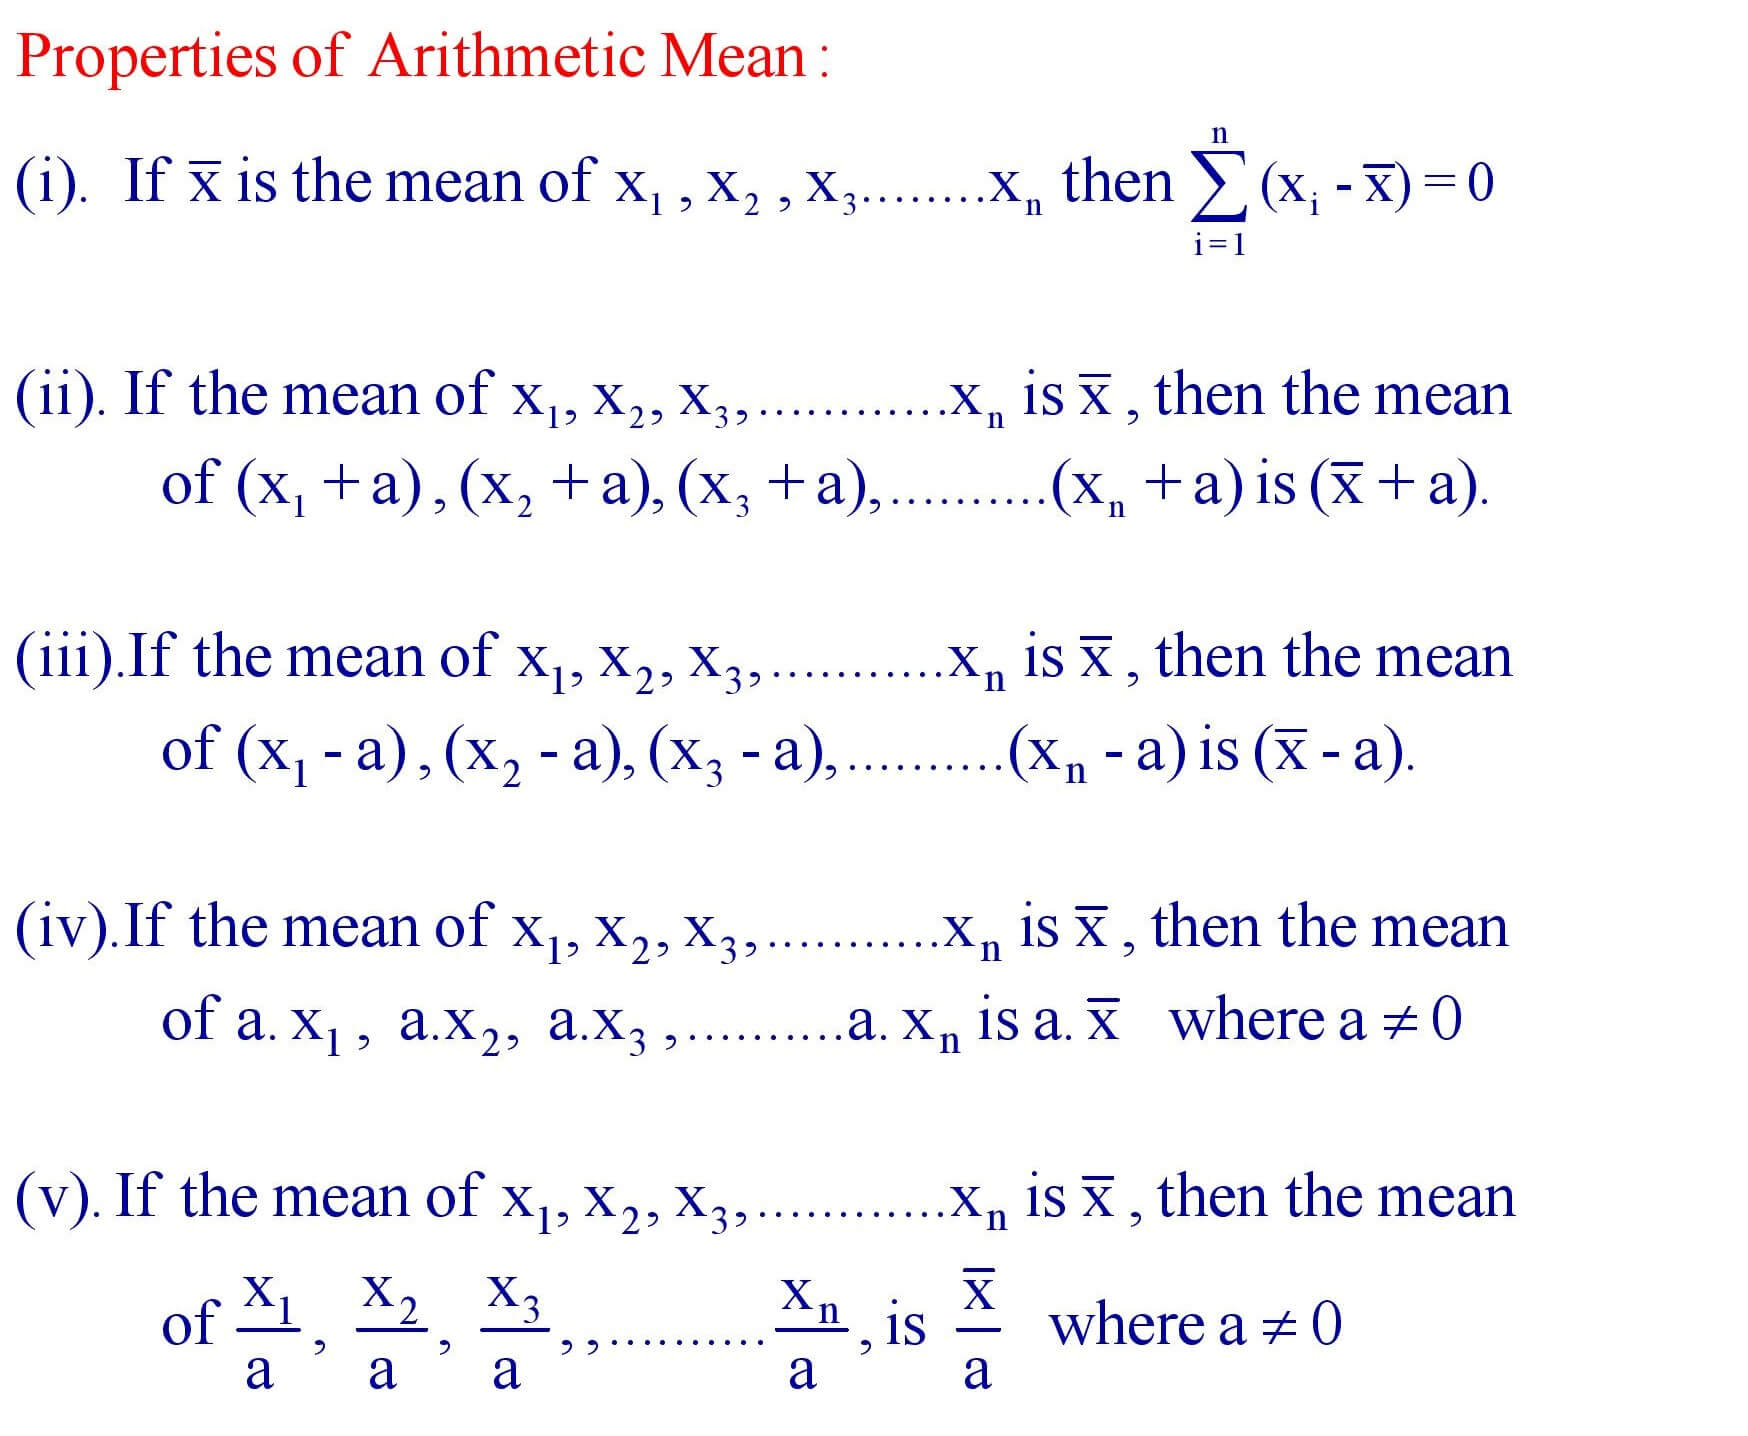
8. Properties of Arithmetic Mean.
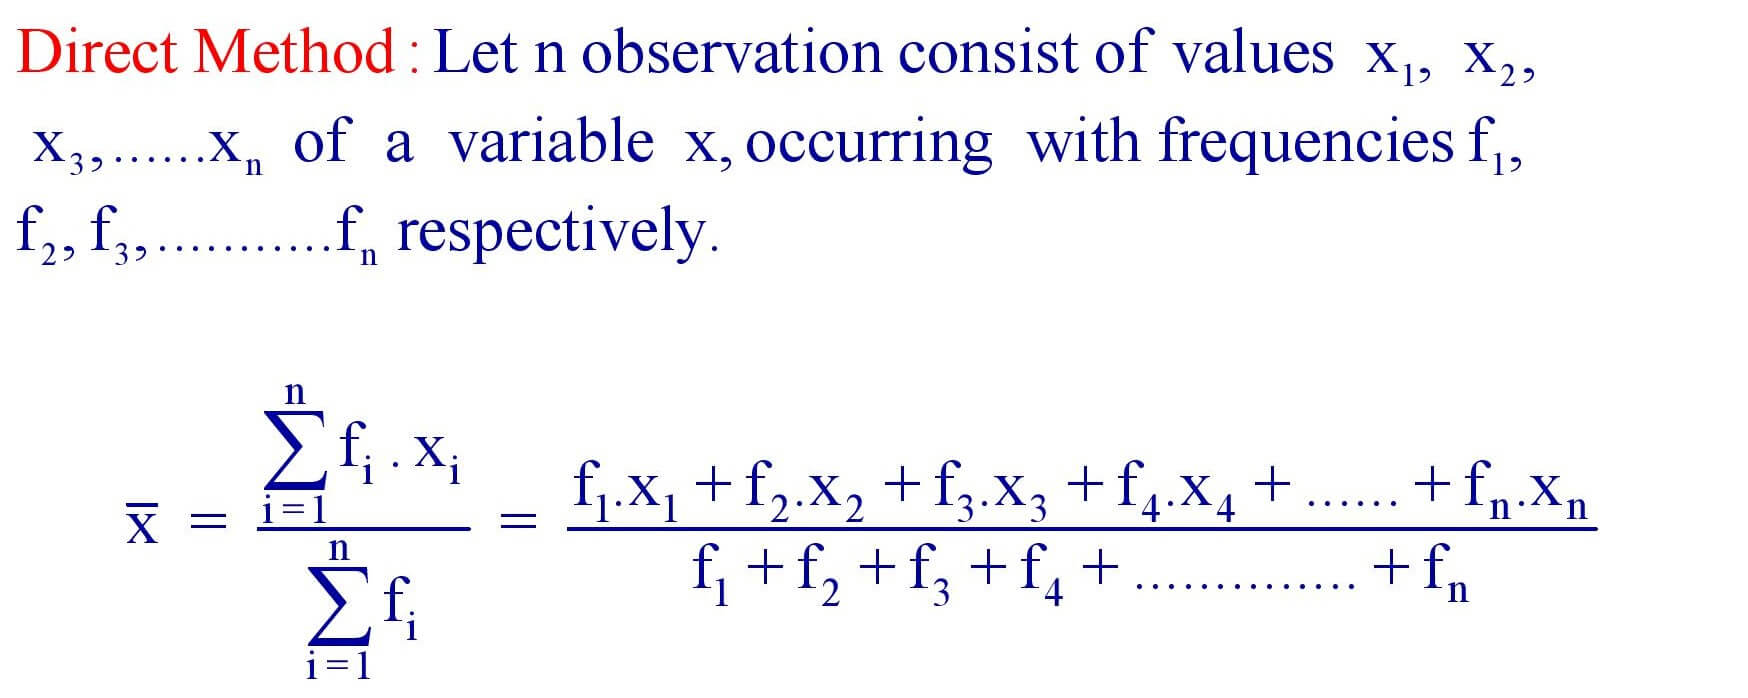
9. Mean for an ungrouped frequency distribution :
(a). Direct Method :
(b). Assumed – Mean Method : When the product ( f i × xi ) involves large numbers then we use the assumed – mean method.
Steps :
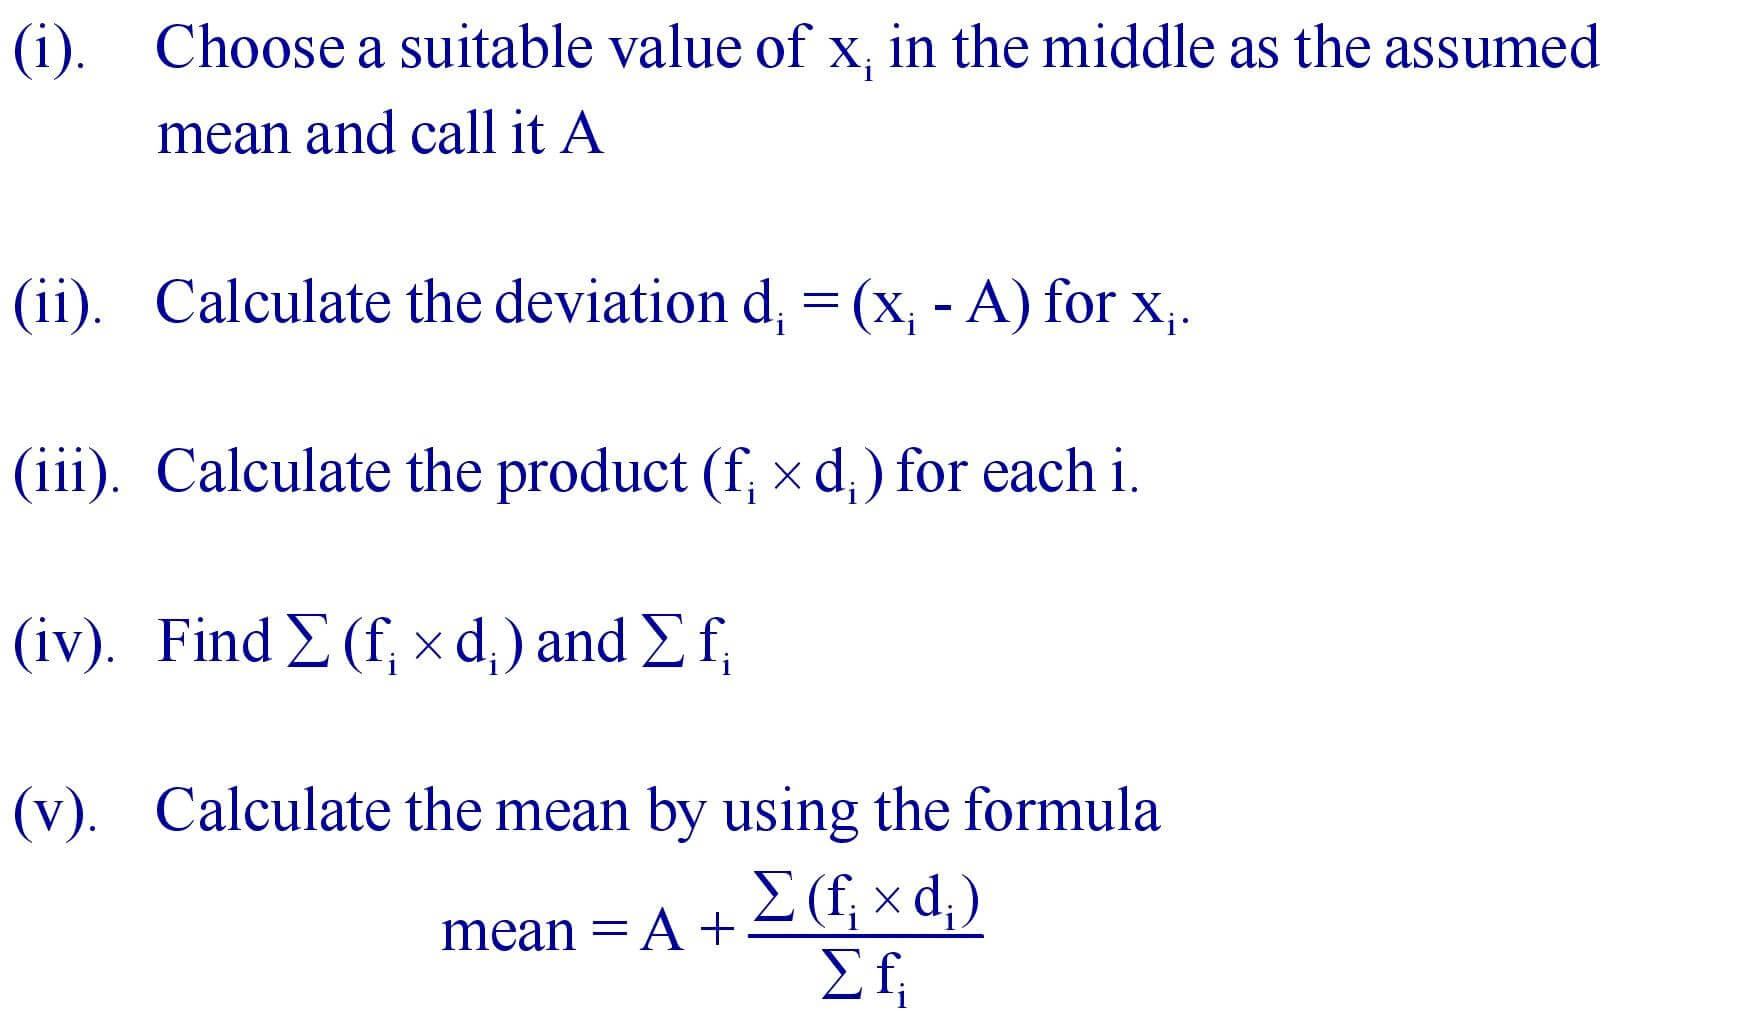
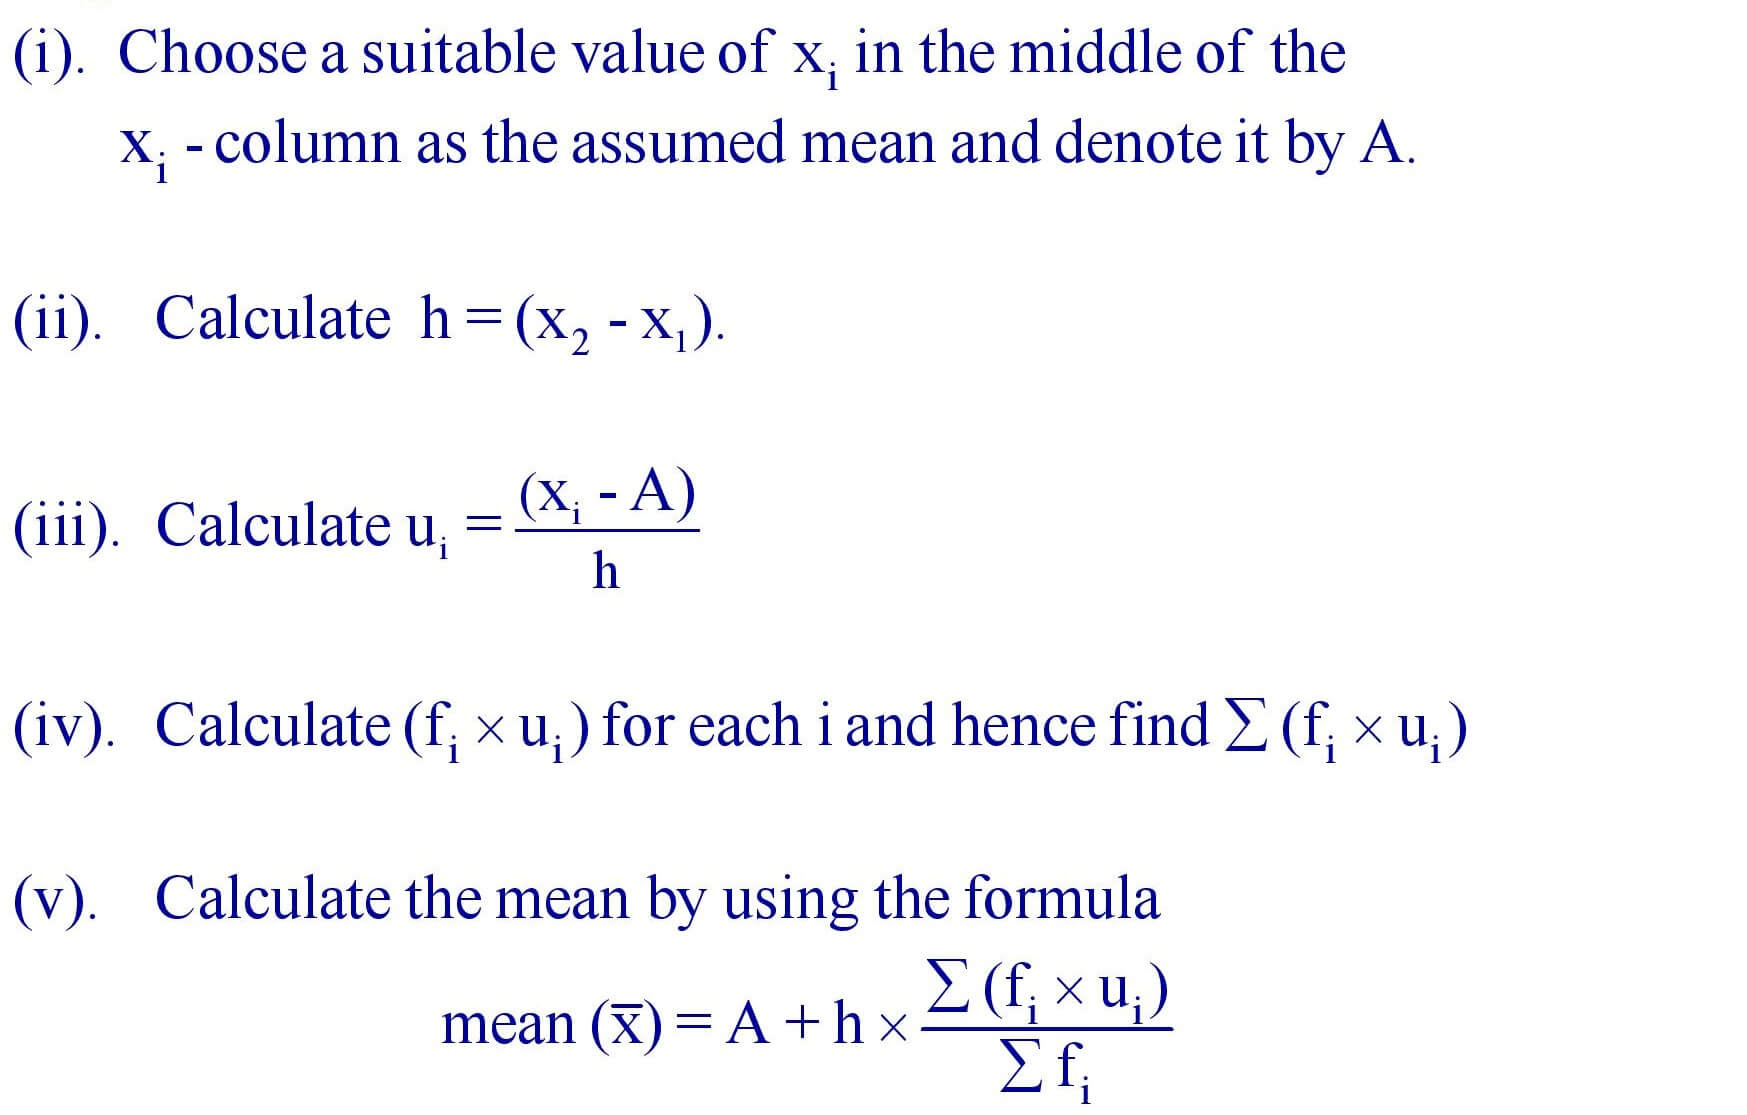
(c). Step – Deviation Method : When the values of xi and fi are large and the values of xi are equally spaced , we use the step – deviation method for finding the mean.
Steps :
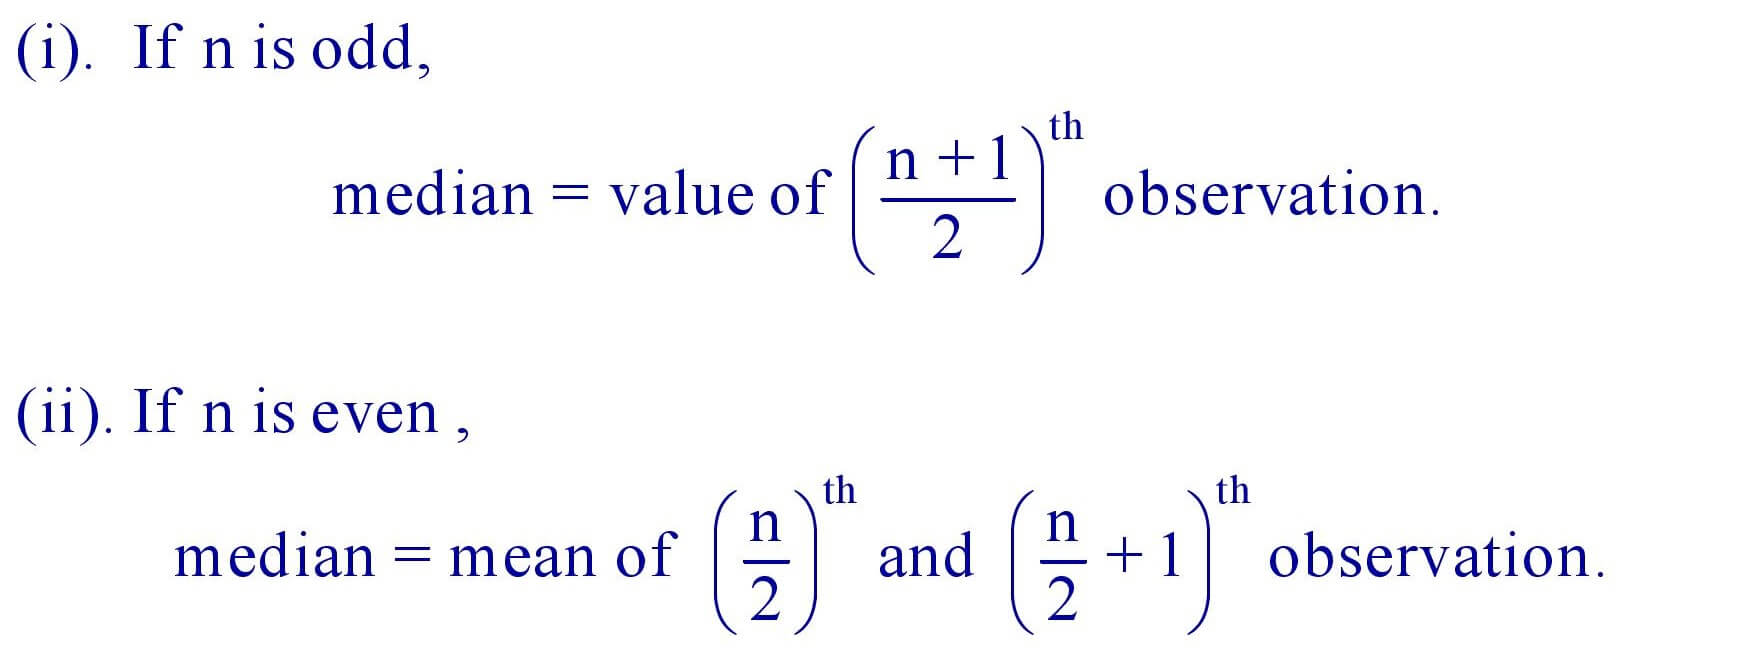
10. Median : It is the value of the middle most observation.
11. Mode is the most frequently occurring observation.
12. Mode = 3 (median ) – 2 ( mean )
| Click here to pdf download |
